NJ MAP project creates online, statewide land-use resource
NJ MAP project creates online, statewide land-use resource
January 23, 2020
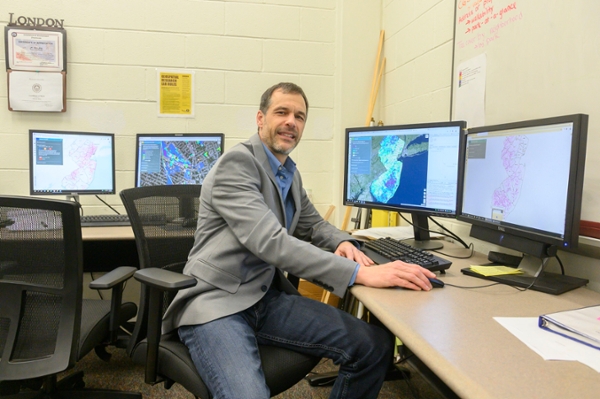
Professor John Hasse
The numbers and facts tell a cautionary tale: Over the past three decades, New Jersey converted 360,652 acres of farmlands, forest and open space to housing developments, highways and shopping malls.
This equates to 25.7 football fields of new urban growth every day since the mid-1980s, a growth pattern that makes the Garden State the most densely populated in America. With roughly 1,200 residents per square mile, it’s denser than India.
Addressing the issue, a long-term, evolving project created by Rowan University faculty, students and staff is helping to shape a shared vision for the state’s sustainability. NJ MAP (http://www.njmap2.com/) is an interactive, online collection of animated maps that gathers decades of state land-use data and visualizes the information to help municipalities, environmental organizations and residents see the big-picture changes around them.
The maps can also help these stakeholders make informed decisions about future development and land conservation, said Dr. John Hasse, a professor of geography and Director of the Geospatial Research Lab at Rowan, who led the years-long project.
“There’s this tension between creating development and communities, and the fact that we’re doing it in an environment that has limited capacity for accepting development before the environment is really impacted,” said Hasse, who started the mappings project in 2011 to track land-development patterns.
NJ MAP is divided into multiple themes, including an animation of residential and commercial development in New Jersey from 1986-2015 (the last year for which statewide data are currently available). There is also a section that prioritizes farmland for preservation and a map that allows users to zoom in on individual parcels for detailed information such as the property’s proximity to specific watersheds, which drain streams and rainfall to a common outlet.
Animated maps tell full story
Having easy access to this information can be vital in making decisions regarding land development in environmentally sensitive areas, Hasse said. Although much of the information on NJ MAP has been publicly available elsewhere, this new, visual collection of data puts it all in context, he added.
While the sheer amount of data on NJ MAP could seem overwhelming, the project’s visual presentation illustrates an important story about the past, present and future of New Jersey development, Hasse said.
For example, one map tracks the loss over time of thousands of acres of peach orchards in Gloucester County to development.
“NJ MAP communicates in a scientific way the changes happening in our back yards, in our communities, and if you do that graphically, where people can zoom in to their town, they can know more about where they live and see the magnitude of development that’s happened over three decades,” Hasse said.
More data, better decisions
NJ MAP can also help municipal officials make better-informed decisions on land-use applications, Hasse said. New Jersey is a “home-rule” state, meaning most decisions regarding land-use issues are made on the local level. Therefore, it’s vital that local planning boards have as much data as possible to help them understand the potential environmental impact of a development project, Hasse said.
NJ MAP is viewable through smartphones and tablets, allowing attendees of planning-board meetings to access information in real time so they may ask informed questions, said Katrina McCarthy Shand ’09, a research associate in Rowan’s Department of Geography, Planning and Sustainability who helped develop the maps.
“The maps can help towns, especially rural ones with smaller budgets, save money because they’ll have access to information for which they’d normally have to hire engineers or other professionals to get,” she said.
Blueprint provides guidance
A recent addition to the project is the New Jersey Conservation Blueprint, a partnership between Rowan’s GeoLab, the New Jersey Chapter of the Nature Conservancy and the New Jersey Conservation Foundation. The blueprint uses a points system to prioritize areas in New Jersey for preservation as open space that could become parkland or other recreation areas. The blueprint also provides a visual ranking of land that is important to agriculture, ecological resources, and water quality throughout the state. (In December, the New Jersey Conservation Blueprint won a 2019 Governor's Environmental Excellence Award.)
Eric Olsen, director of the Lands Program for the New Jersey Chapter of the Nature Conservancy, said the conservation blueprint helped unite the state’s major environmental groups, which can often have opposing agendas.
“It catalyzed the conservation community, because time is of the essence,” he said. “It created the impetus for us as a land-conservation community to begin developing a vision.”
The blueprint is helping the environmental groups form answers to such questions as, “how do we continue to ensure that people in urban areas have access to parks and farmers markets?” Olsen said.
Michael Brein ’17, began working on NJ MAP as an undergraduate in the geography department and he’s now a web-mapping specialist assigned full time to NJ MAP.
“For a long time, we’ve just been kind of building and developing land in New Jersey,” Brein said. “We’re using up a lot of land, and if we’re going to build a sustainable future, we’re going to have to think about conserving some of that land.”
NJ MAP democratizes the land-use process, Brein said.
“If you’re looking to help put land into preservation and conservation in your community and you’re struggling with where to start, NJ MAP is a great tool,” Brein said. “It will provide you with data you’d have to jump through hoops to get otherwise.”
NJ MAP received funding through public and private grants, as well as through state government contracts for creating specific environmental mapping. Rowan’s Department of Georgraphy, Planning and Sustainability now seeks long-term funding for the project, Hasse said.
Educational outreach
The department works with K-12 and college teachers to create educational models via NJ MAP in their classrooms, Hasse said.
Though the initial phase is complete, NJ MAP will continue to expand, he said. Themes in the works include animated climate maps for New Jersey and maps illustrating solid-waste volumes throughout the Garden State — how much trash and recyclable materials each municipality produces.
Ultimately, the project aims to transform the way New Jersey residents think about their state.
“Development patterns that respect New Jersey’s outstanding environmental resources can result in environmentally sustainable smart growth communities rather than unchecked suburban sprawl,” Hasse said. “NJ MAP is helping to provide that sustainable vision.”